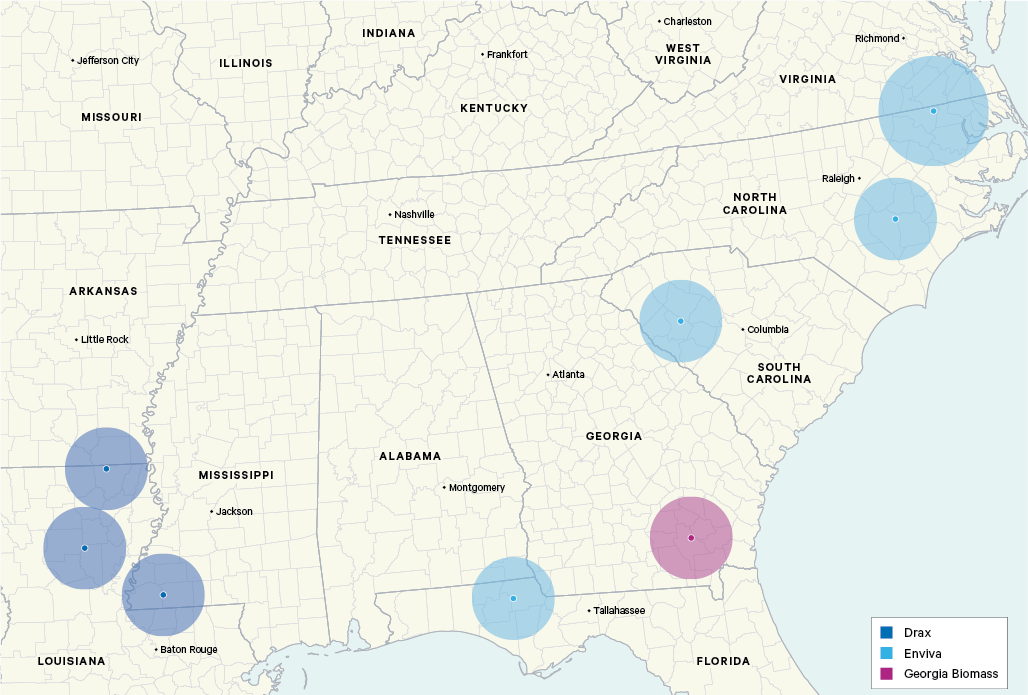
Similarly to previous studies, and as per common practice when assessing the procurement area for a mill, a circle with a 50-mile radius centred on each mill was used to approximate this area. The analysis assumed no overlap in the procurement areas between mills. One exception was the three Enviva mills situated close together around the North Carolina-Virginia border, near the company’s Port of Chesapeake facility. In this specific example, a procurement area with a 75-mile radius was established, centred at the mid-point between the three mills.
All of the pellets produced by the three Drax-owned mills were assumed to be exported to the UK. In order to match the total quantity of pellets imported to the UK (according to UK import data) and used by Drax from all southern US mills (as shown in Table 9 above), the quantity of pellets exported from each of the remaining seven selected mills was reduced by 29.8 per cent; the adjusted figures are shown in Table 11. This accounting adjustment was necessary because the data on production of pellets by the different mills in the US is not directly associated with exports from US ports to specific countries, meaning that not all of the production of pellets by most mills (except those operated by Drax) would be exported to the UK.
|
|
|
|---|
|
Enviva Cottondale
|
565,492
|
|
Enviva Greenwood
|
323,138
|
|
Enviva Northampton
Enviva Southampton
Enviva Ahoskie
|
1,168,214
|
|
Enviva Sampson
|
429,914
|
|
Drax Amite
|
578,000
|
|
Drax La Salle
|
496,000
|
|
Drax Morehouse
|
578,000
|
|
Georgia Biomass
|
474,047
|
|
Total
|
4,612,805
|
Source: Compiled by the authors, based on mill production data and export/import data.
Note: All production by the Drax-owned mills was assumed shipped to Drax Power Station. Assumed exports from the remaining mills were reduced by 29.8 per cent so that the total exported from all mills was equal to the total imported from the southern US to the Drax facility in the UK.
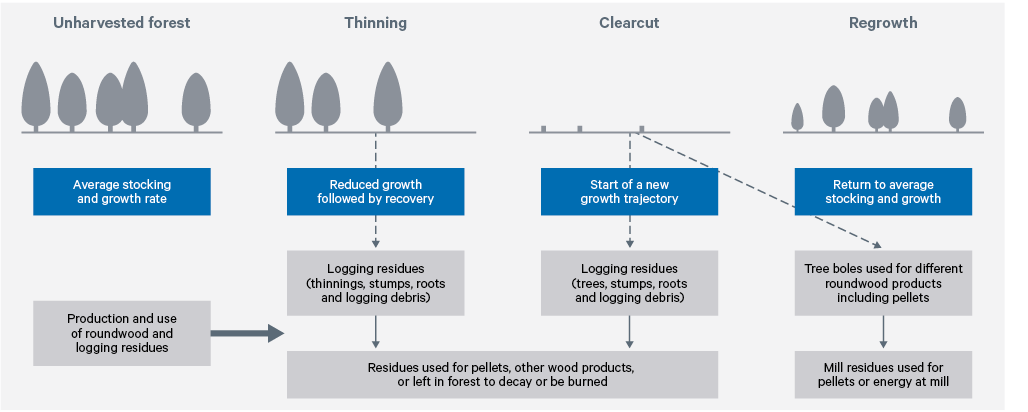
The main categories of source material used for wood pellets in the US are waste wood (logging residues and mill wastes) and roundwood. Logging residues are defined by the USDA Forest Service as tree limbs, tops and stumps that are typically left behind in the forest after logging operations remove the merchantable boles of live trees. Also, by definition logging residues may include trees damaged or killed in the course of logging and left behind, unmerchantable live trees such as small-diameter trees or undesirable species and live trees from pre-commercial thinning (including other intermediate harvest operations in naturally regenerated forests). There is scant evidence that pre-commercial thinning is a common practice in the southern US., Mill wastes include sawdust and trimmings such as slabs and edgings from tree boles that are processed for various products in lumber mills. Much of this material is burnt for power in the lumber mills that produce the waste, but some of it is now being used to produce wood pellets and other composite wood products. Roundwood consists of merchantable-sized live trees that are harvested for various wood products such as pulp and paper, lumber and plywood. In the southern US, roundwood is typically harvested by commercial thinning and clearcut. The wood harvested from any specific logging operation may be used for multiple products. Often the poorest quality and lowest value wood is used for pellets.
The quantities of the different sources of biomass used by each selected pellet mill in 2019 were taken from the Forisk Wood Bioenergy US Database, which reports green tons of pulpwood (referred to here as roundwood), logging residues and mill residues. The Forisk data allowed for simulating individual mill contributions to exports of pellets to the UK and to Drax specifically, as well as the impacts of pellet production on the mills’ supply regions. Results from individual mills were aggregated and then the exports sourced from non-Drax mills were adjusted as described earlier to match the actual imports of pellets for use by Drax in the UK.
Two adjustments to the reported amounts of source material in the Forisk database were made. First, Drax reports for 2019 suggest that about 55 per cent of all source material was from roundwood. Therefore the amount reported by Forisk for the mills that export to the UK (61 per cent) was reduced accordingly (Table 11) and considered part of a ‘scenario 1’ estimate of roundwood used for pellets. Second, after this first adjustment, a ‘scenario 2’ estimate was made for roundwood. This was because estimates reported by Forisk and by Drax are likely to be biased downward, because of a reluctance by pellet mills to acknowledge their harvesting of live trees. To account for this possibility in scenario 2, 50 per cent of the total reported logging residues used for pellets was reallocated to the roundwood category (Table 12). This approach is based on the broad legal definition of logging residues, which as described earlier can include pre-commercial thinning of live trees and other non-commercial live trees that may be harvested along with merchantable trees. Based on these adjustments, the estimate of roundwood used to produce pellets in the US for export to the EU and UK amounts to
55–67 per cent of the total supply of biomass from all sources.
|
|
|
|
|---|
|
Roundwood
|
2,537,043
|
3,083,764
|
|
Logging residue
|
1,093,442
|
546,721
|
|
Mill residue
|
982,320
|
982,320
|
|
Total
|
4,612,805
|
4,612,805
|
Source: Compiled by the authors: as reported in mill production records compiled in the US.
Note: The reported total was adjusted downward to match estimated imports from the US by Drax. The amount of roundwood reported by Forisk was also adjusted downward to match the percentage reported by Drax (55 per cent) for scenario 1. In scenario 2, one-half of the reported logging residues was shifted to the roundwood category.
Since there is no publicly available quantitative data on the amount of roundwood that comes from commercial thinning vs final harvest, and since the type of harvest determines the impact on growth, both scenarios were further defined to help establish bounds for the impact of using roundwood on forest carbon. Scenario 1 assumed that all harvest was from commercial thinning, while scenario 2 assumed that all harvest was from final clearcut. This approach provided for a wide range of estimated impacts on forest carbon stocks and sequestration following harvest, with the actual values expected to be within those extremes.
The USDA Forest Service forest inventory database was queried to estimate the characteristics of the assumed procurement areas based on the most recent forest inventories for the southern states. Inventory dates based on the time of field measurements ranged from 2012 to 2019, and the time between successive measurements varied from five to seven years among states depending on implementation schedules. Variables used in this analysis were estimated by forest type and stand origin – i.e. whether planted or artificially regenerated. Variables derived from the inventory data included: forest area; the main non-soil (biomass, dead wood, litter, and understory) carbon stocks and stock changes; harvest areas and above-ground biomass harvested; and data to calculate the proportion of total tree biomass allocated to bole, stump plus roots, and branches plus tops. The total number of inventory sample plots falling within the procurement areas associated with the 10 mills was 4,640.
The previous estimates from publicly available forest inventory data and mill surveys were used to infer the impact of pellet production on biomass stocks, carbon accumulation in the source areas and emissions from burning pellets by type of source material. To estimate the direct emissions from burning pellets sourced from roundwood, logging residues or mill residues, the average emissions figure reported by Drax for 2013–19 – 1.80 tonnes CO₂ per tonne of wood pellets – was used (see Section A1).
(In fact, the same figure results from converting the dry weight of the pellets to CO₂, assumed to be 100 per cent emitted when burnt, using the following unit conversion factors:
- One US ton = 0.907 metric tonne
- One green unit of roundwood or residue = 0.45 dry unit
- One dry metric tonne biomass = 0.49 metric tonnes carbon
- One metric tonne carbon = 3.67 metric tonnes CO₂
- One dry metric tonne of wood pellets = 1.8 metric tonnes of CO₂.)
Estimating the impact of harvesting roundwood for pellets on forest carbon accumulation required estimates of the area and biomass attributed specifically to pellet production. The supply of wood for pellets is typically integrated with the supply of wood from harvesting for other products like lumber and paper. Therefore, it was necessary to assume that wood for pellets has a proportional impact on forests, according to the mass of pellets produced compared with the mass of wood harvested for all purposes. The proportion of area and biomass represented by harvesting roundwood for pellets was estimated by dividing the dry biomass of pellets from roundwood by the total biomass harvested in the procurement areas for all products, for scenarios 1 and 2 of estimated roundwood used. As described above, scenario 1 reflected reported estimates of roundwood used plus the assumption that all harvest of live trees for pellets was by thinning. Scenario 2 was defined by transferring some of the source material from the logging residue category to the roundwood category, plus assuming all harvest for pellets was done by clearcut.
The average annual forest carbon increment lost from harvesting for pellets was estimated by multiplying the area-equivalent harvested by the difference between the reduced growth from harvesting live trees and the growth that would have occurred if the trees had not been harvested, accumulated over the number of years it would take to reach the pre-harvest rate of carbon increment. These values were estimated from growth rates by age class from the forest inventory data. It assumed ages of 17.5 years for commercial thinning and 27.5 for final harvest of naturally regenerated forests, and 12.5 years for commercial thinning and 22.5 years for final harvest of planted forests., Assumed ages of harvest were confirmed by examining forest inventory data showing harvest areas by forest age class, though the average ages of harvest may not reflect the fact that some older forests are also harvested. Calculations were carried out separately for planted and naturally regenerated forests, owing to the significant difference in average growth rates and harvest ages between the two (Table 13).
|
|
|---|
|
Harvest type
|
All types
|
Loblolly-shortleaf
|
Oak-pine
|
Oak-hickory
|
|
Natural regeneration
|
|---|
|
Thinning
|
2½
|
3
|
2
|
2
|
|
Clearcut
|
7½
|
6
|
6
|
15
|
|
Plantation
|
|---|
|
Thinning
|
1½
|
1
|
2½
|
2
|
|
Clearcut
|
6
|
6
|
8
|
15
|
Source: Compiled by the authors.
Note: These estimates were calculated from analysis of harvest and growth rates by age class from forest inventory data, for the respective forest types and stand origins. Thinning is sometimes associated with faster volume growth, but available evidence indicates that there the removal of live trees causes reduced CO₂ uptake for a period of time (see discussion in Chapter Two).
The loss of carbon from the decay of roots and from the decay of unused logging debris in the harvested forests were also estimated for harvested roundwood attributed to increasing pellet production, using average ratios of roots and logging debris to the biomass of the harvested tree bole of 1.26 and 1.172, respectively. These ratios are based on estimates of the carbon stored in different tree parts as reported in the forest inventory database for the assumed procurement areas, using component ratio biomass equations. Logging debris used for other products besides pellets was excluded from the calculations.
All of the estimates were summarized for all mills combined using common units of carbon and CO₂, accounting for the proportion of all pellets produced by the mills that were shipped to the UK and used at Drax.
Results – procurement areas and net emissions by source of material
The procurement areas around the 10 pellet mills contain 11 million hectares of forest (Table 14). About 4 million hectares are plantation forests and 7 million hectares are naturally regenerated. Loblolly-shortleaf pine is the most common forest type, with more than 4 million hectares. Of this, 61 per cent or 2.6 million hectares are planted.
|
|
|
|
|
|
|
|---|
|
Natural regeneration
|
7,119,802
|
1,662,147
|
948,479
|
1,874,467
|
2,634,709
|
|
Plantation
|
3,976,266
|
2,621,233
|
246,656
|
142,866
|
965,512
|
|
All origins
|
11,096,068
|
4,283,381
|
1,195,135
|
2,017,332
|
3,600,220
|
Source: Compiled by the authors.
Note: The most common forest types that supply timber are specified. Areas are unadjusted for small amounts of overlap between procurement areas.
The average annual net change in carbon stocks within the procurement areas is highest for loblolly-pine plantations at 4.72 tonnes C/ha/yr, followed closely by plantations of ‘other types’, mainly composed of longleaf-slash pine and elm-ash-cottonwood (Table 15). Naturally regenerated forests have lower carbon growth rates than plantations.
|
|
|
|
|
|
|
|---|
|
Natural regeneration
|
2.29
|
3.43
|
2.59
|
2.04
|
1.63
|
|
Plantation
|
4.45
|
4.72
|
2.38
|
1.50
|
4.67
|
|
All origins
|
3.06
|
4.22
|
2.55
|
2.00
|
2.45
|
Source: Compiled by the authors.
Tree harvests for all products within the procurement areas total 373,000 hectares annually, affecting 3.4 per cent of the total forest area (Table 16). Nearly two-thirds of the harvest area is plantation forest. Of the 18.5 million tonnes of biomass harvested annually for all types of wood products, about 12 per cent is harvest residues that are either left in the forests or used for timber products that can accept low-grade wood, such as pellets and particleboard. Of the total biomass harvested for all products within the procurement area, 10 per cent was attributed to pellet production in scenario 1 and 12 per cent in scenario 2.
|
|
|
|
|
|---|
|
Area harvested (ha/yr)
|
372,626
|
141,905
|
230,721
|
|
Biomass harvested (tonnes C/yr)
|
18,493,140
|
8,127,292
|
10,254,466
|
|
Harvest residues (tonnes C/yr)
|
2,568,822
|
1,172,184
|
1,225,676
|
Source: Compiled by the authors.
CO₂ emissions from different sources of biomass used for pellets burnt in Drax
As a result of this analysis, annual net emissions of CO₂ from pellets sourced from the southern US and burnt in Drax were estimated at between 11 million and 13 million tonnes in 2019 (Table 17). This estimate includes:
- Emissions to the atmosphere from burning the pellets (calculated from emissions reported by Drax – Section A1): 8.3 million tonnes.
- Emissions from the supply chain (calculated from emissions reported by Drax – Section A2): 1.1 million tonnes.
- Emissions from the decay of roots and unused logging residues left in the forest after harvest and forgone removals of CO₂ from the atmosphere due to the harvest of live trees (calculated as explained above): between 1.5 million tonnes (scenario 1) and 3.6 million tonnes (scenario 2).
|
|
|
|
|---|
|
Combustion emissions
|
|---|
|
Roundwood used for pellets
|
4,566,677
|
5,550,775
|
|
Logging residue used for pellets
|
1,968,196
|
984,098
|
|
Mill residues used for pellets
|
1,768,176
|
1,768,176
|
|
Supply chain emissions
|
|---|
|
Supply chain
|
1,114,334
|
1,114,334
|
|
Impact on forest carbon
|
|---|
|
Decay of logging residues
|
1,432,293
|
1,740,945
|
|
Lost forest growth
|
115,280
|
1,882,909
|
|
Total
|
10,964,956
|
13,041,237
|
|
Additional percentage of combustion from lost forest growth and decay of residues
|
19%
|
44%
|
Source: Compiled by authors.
Note: ‘Lost forest growth’ and ‘decay of logging residues’ represents the removal of CO₂ from the atmosphere that would not have occurred if the roundwood had not been harvested.
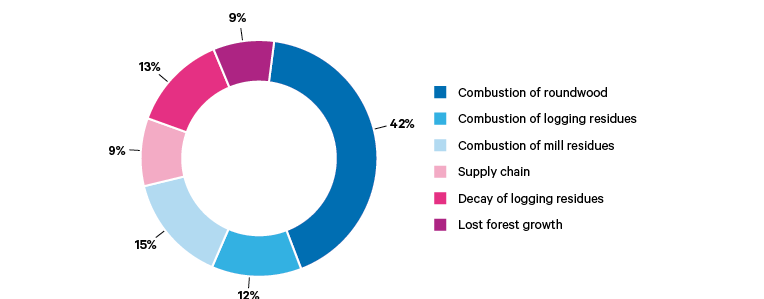
The largest difference in estimates among the source categories for scenarios 1 and 2 is for lost forest growth. This is due to the dual effects of using less roundwood and only wood from thinnings (which has a faster growth recovery) in scenario 1, compared with using more roundwood and only using wood from clearcut harvest in scenario 2. All sources considered, the actual emissions associated with burning the pellets are 19 to 44 per cent higher than combustion emissions alone when accounting for changes in the net carbon balance of the forests (decay of residues plus lost forest growth) in the procurement areas.
Of the different emission sources, the midpoint of the two scenarios suggests that the combustion of roundwood accounted for about 42 per cent of total emissions (Figure 10) and 61 per cent of the combustion emissions (Table 17) from burning pellets. Based on the amount of biomass harvested by stand origin for all products including pellets (not shown in table), 56 per cent of the roundwood used for pellets comes from forest plantations and 44 per cent from stands established by natural regeneration. The combustion of logging and mill residues, which are often cited as a main source of wood for pellets, accounted for 12–15 per cent of the total net emissions, respectively, for the midpoint of the two scenarios.